Explore market data with the power of Tableau
True insight comes from exploring market data on your own terms. Fixed graphs and printouts of tables of numbers have been around since the 1990’s. It’s time to leverage the power of modern data visualization tools to view and interact with market data in a new way.
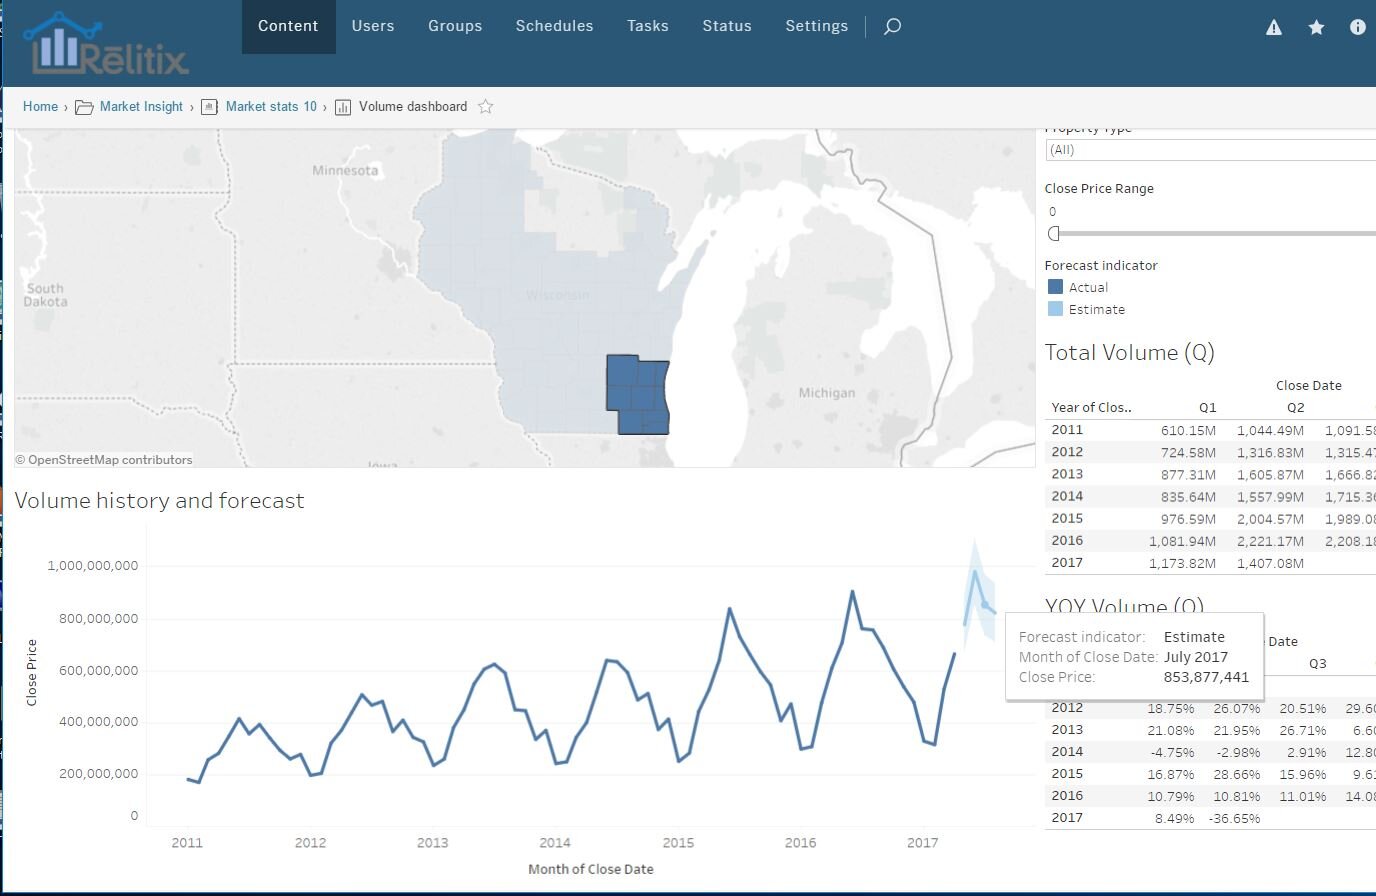
Relitix lets you interact with market data in ways impossible using legacy systems. Want to know the year over year price growth in suburban starter homes in Waukesha County? What happens if we add Washington County? How much sales volume growth is happening downtown Madison, excluding suburban zip codes? All these questions are answerable in a few clicks.
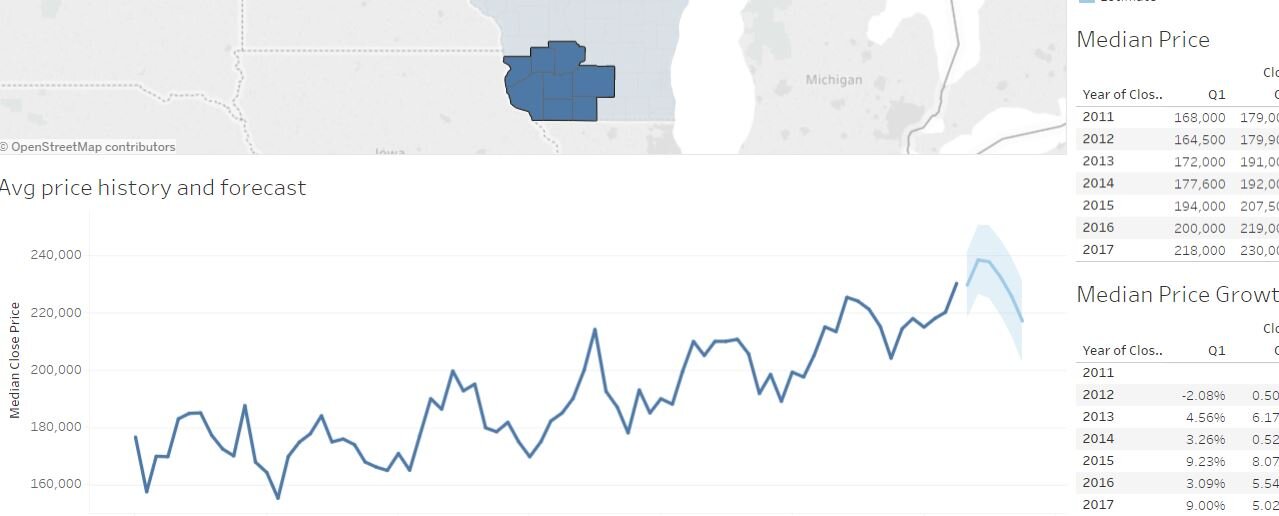
Explore Median Price History and Forecasts
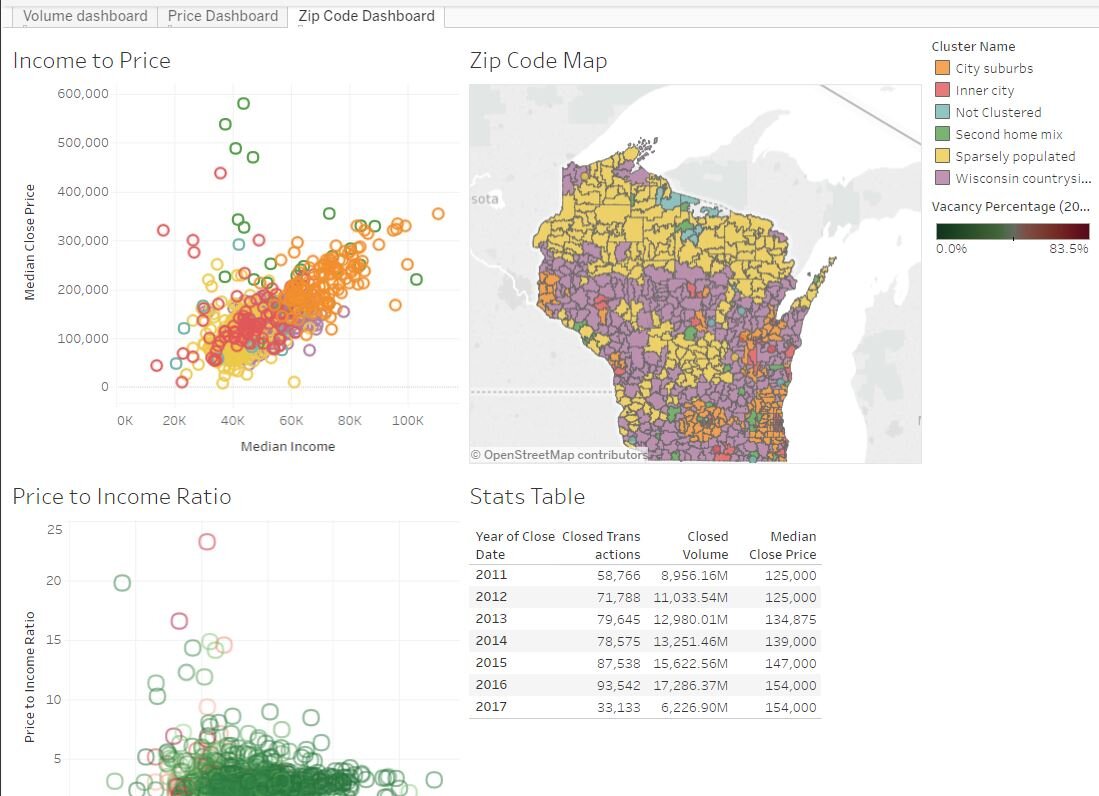
Take your market analysis to the next level by combining MLS stats with census data to uncover price-to-income and population trends at the zip code level.