
In our last blog post we discussed how the production of newer agents follows a predictable pattern. This pattern is driven by a sorting out process whereby lower production agents (and non-producers) self-select out of real estate boosting the average production by rookie “class year” in the process – truly a Darwinian survival of the fittest. This week we’ll look at the rate at which agents leave real estate.
We’ll examine license and MLS data in Wisconsin and Arizona. Figure 1 shows the percentage of licensees who still retain an active license by years since original license issuance in both states.
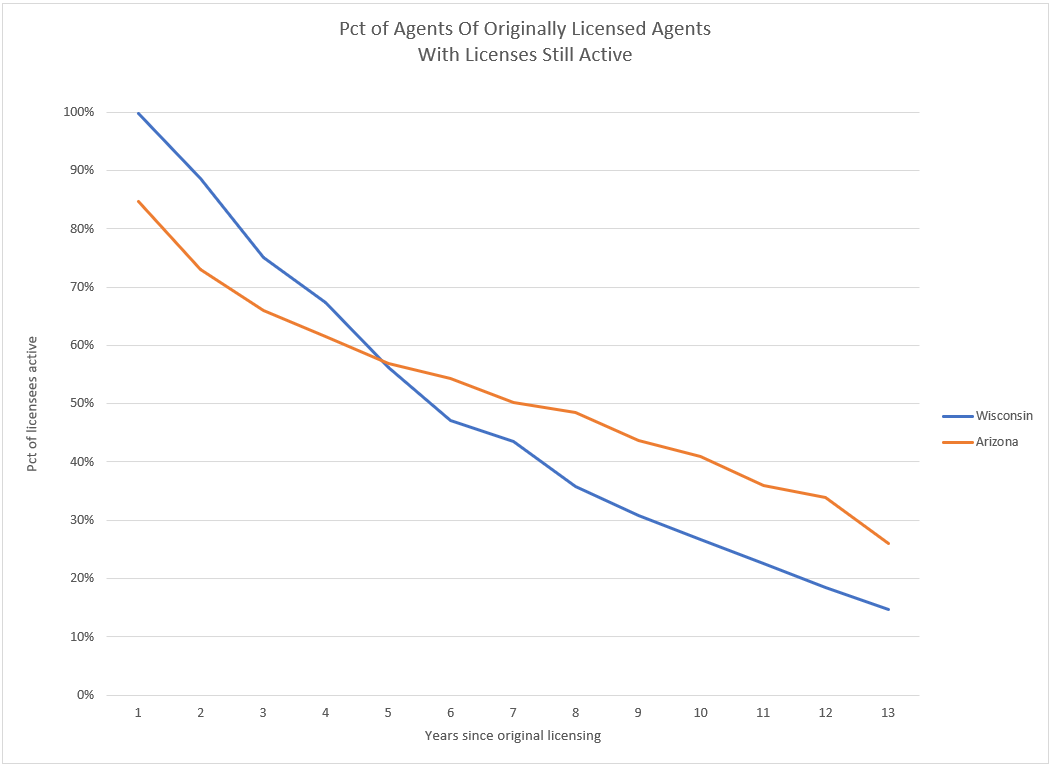
Fig 1. The percentage of real estate licensees still retaining active license by years since original licensure.
Wisconsin and Arizona have different licensing fees, continuing education requirements, and housing markets so the graphs aren’t identical, but they are very similar. By year 5 (Wisconsin) or 6 (Arizona) about 1/2 of the licensees have let their license lapse. The slope of the curves begins to decrease after year 4 indicating that the rate of licensee lapsing begins to decrease at that point. It should be noted that Wisconsin has a dual licensing system where about 10% of licensees eventually upgrade to a Broker’s license. Fig 1 only accounts for Wisconsin salesperson licensees which may explain the lower retention percentages after year 5.
Looking beyond merely retaining a license, how does participating in the MLS decrease over time? Figure 2 shows participation rates in ARMLS and WIREX MLS’s (defined as closing at least one transaction) by years since licensing. We have normalized these graphs to the rate of the 2019 licensees.
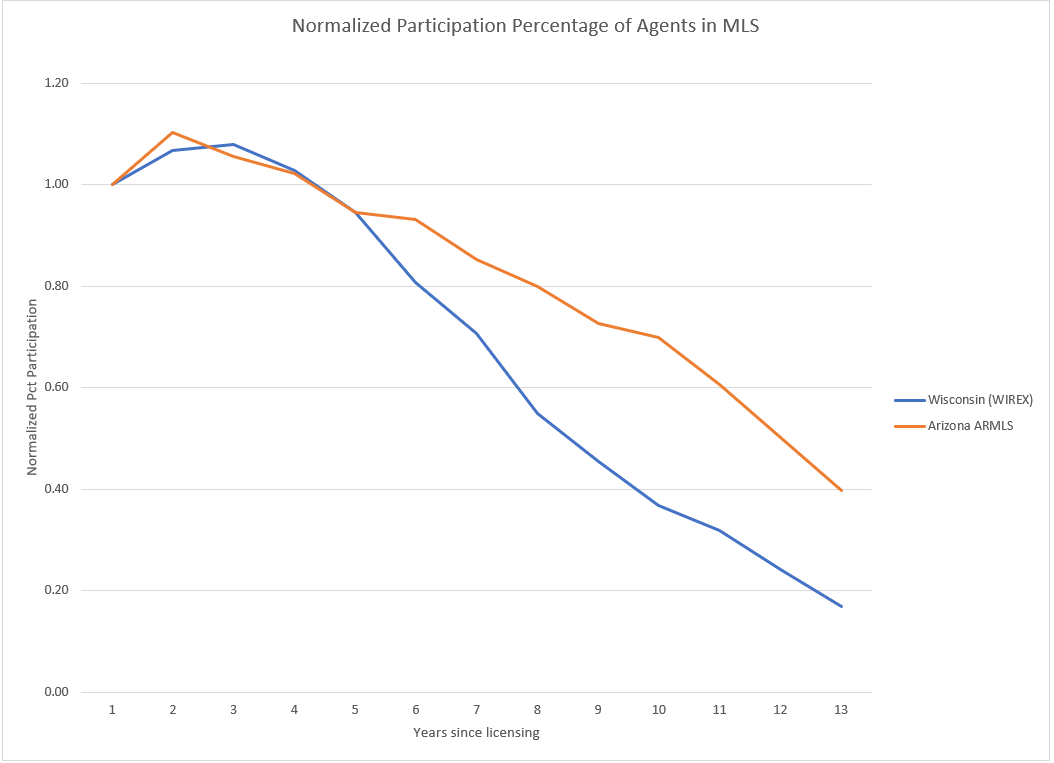
Figure 2. Normalized participation rates in WIREX/ARMLS by years since original license. WIREX includes only salesperson licensees.
It is interesting that the rate of participation climbs for the first two years as new licensees find firms and begin to record their first transactions. Then the overall attrition from the business dominates and the exodus begins. The ARMLS market seems more conducive keeping active agents than does Wisconsin.
We’re fortunate to have a complete set of license data from Arizona which allows us to take a long-range look at agent participation over time. This is shown in fig 3.
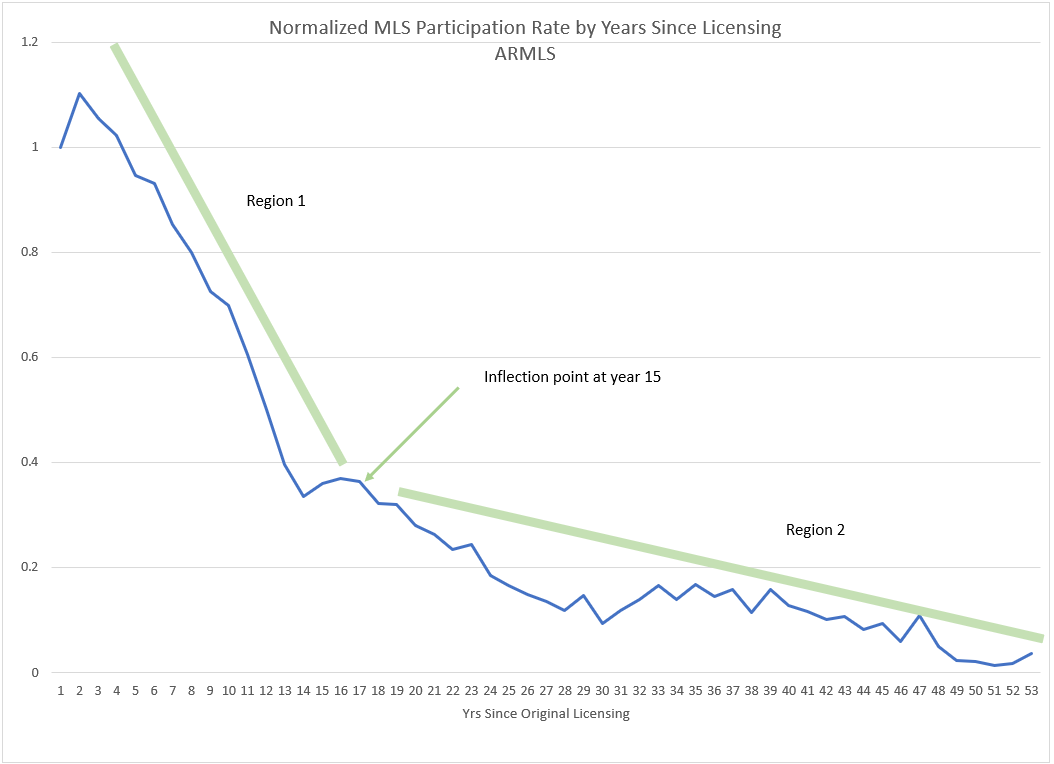
Fig 3. ARMLS normalized participation rate over time
This graph reveals different rates of departure from the business. In region 1 (years 2-15) agents leave the business at a steady and relatively high rate. In region 2 (years 16+) the rate of departure decreased markedly. The inflection point is year 15 which we can interpret as the point in an agent’s career where the die has been cast and they are committed to real estate as a life-long career.