
Common sense would suggest that a real estate office’s effective market area is closely related to population density. We can use the average distance (straight-line) from the listing office to the listing as a means of measuring the market capture area for firms and agents. Using Wisconsin, with its mix of rural and dense urban areas, as our laboratory, we can start by start by mapping average distance from office to listing by census tract. In this map red represents smaller numbers with green as larger. We use 2019 listings for this analysis.
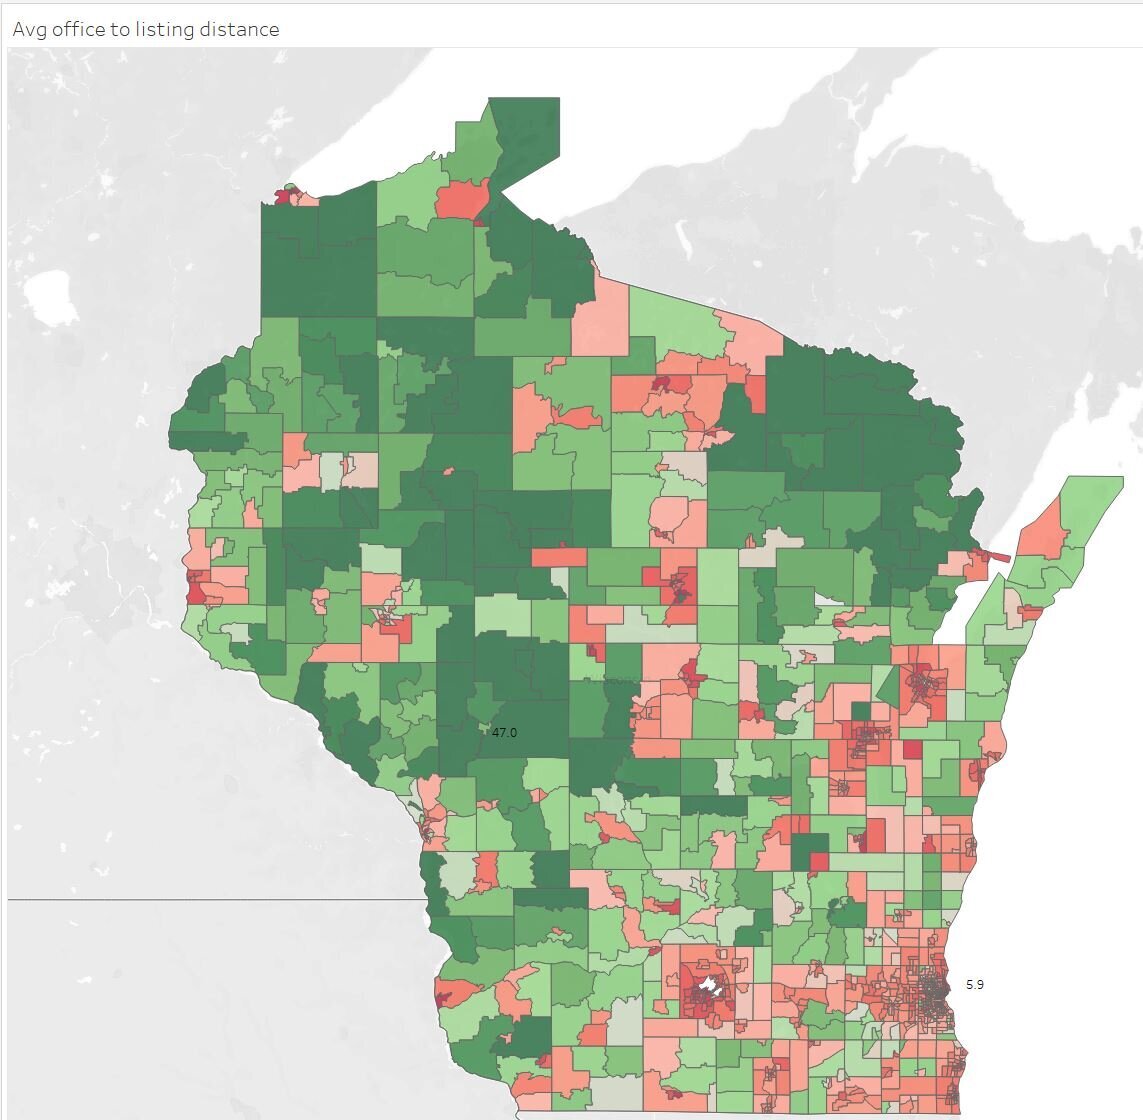
The relationship between population density and distance to listing is very clear. Agents in Madison, Milwaukee, and Green Bay travel on average 6 miles or less from their office to their listings compared to distances in excess of 20 miles or even 30 miles in sparsely populated areas up north. Perhaps more surprising is the size of the market areas in smaller outlying municipalities. The dark red dots scattered around the perimeter of the map suggest that these smaller cities are, in general, serviced by local brokers who work out of offices in middle of their markets. These brokers service the outlying countryside between towns and villages. This reinforces the importance of having a local office presence in small and medium sized towns and casts doubt on a strategy of relying on larger hub offices to service these markets.
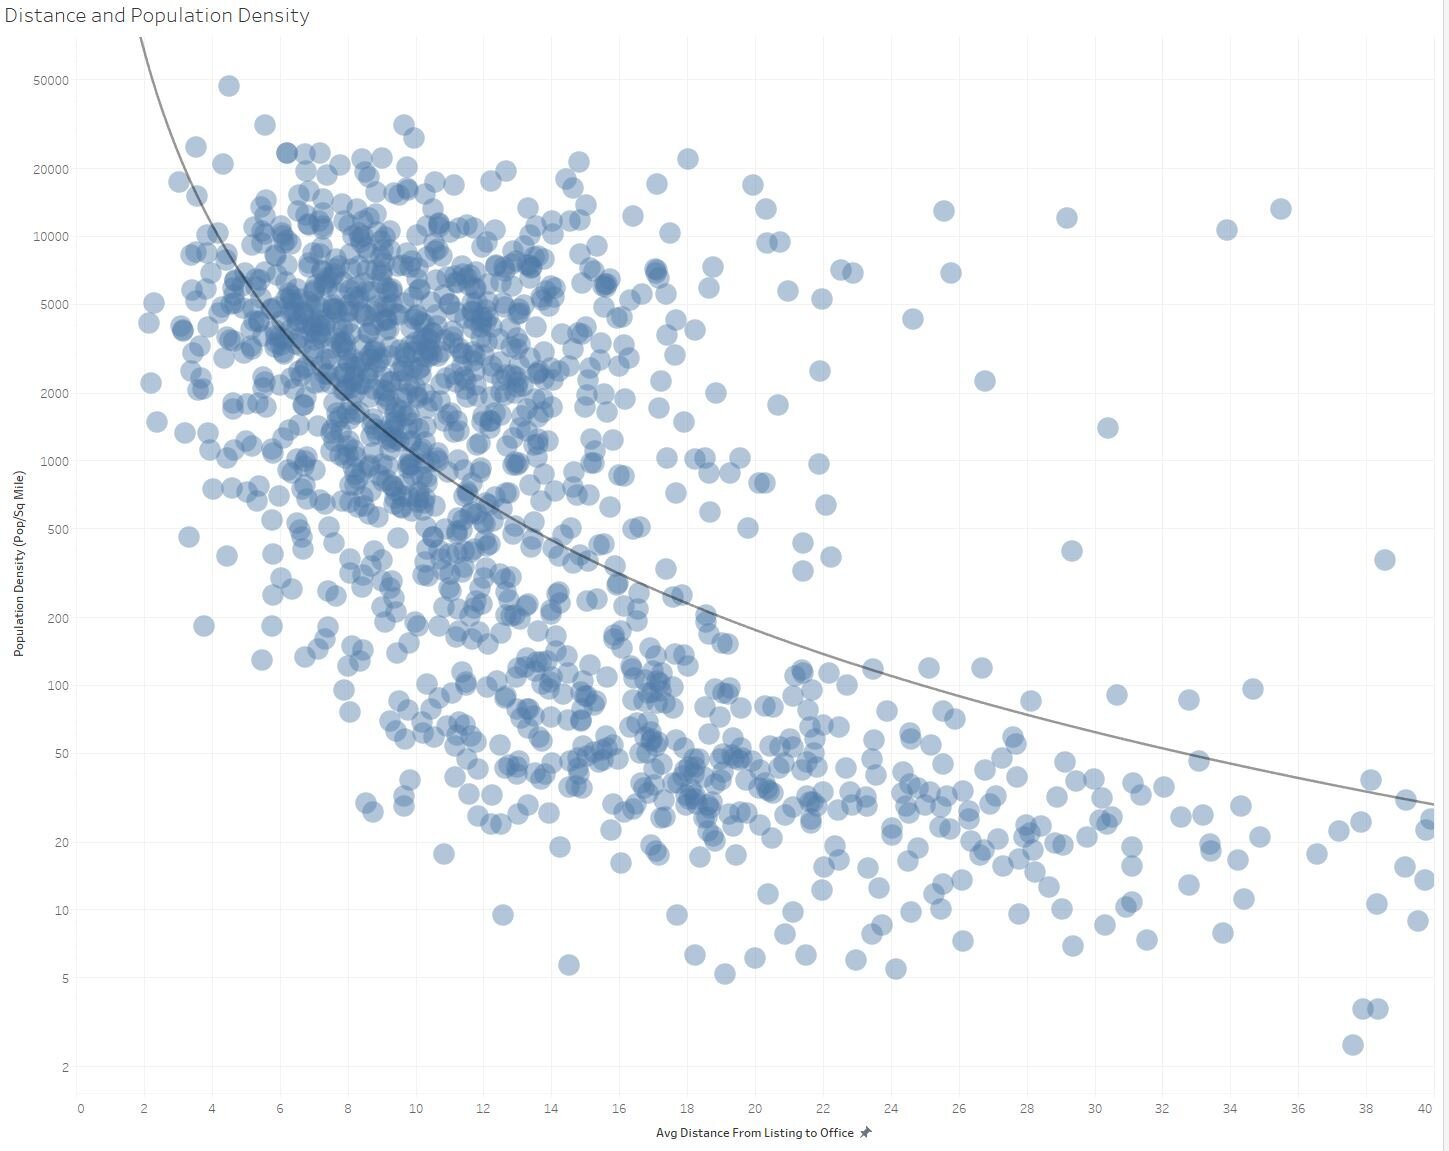
Plotting distance to listing against the population density of the census track reveals a rough “power law” relationship. The urban tracts are represented in the dense cluster of dots in the upper left of the graph. Smaller towns and cities are the cluster of dots in the bottom center. There are, however, plenty of outliers. The dots in the upper right of the screen represent high-density (urban) tracts not well-served locally representing potential market opportunities They may also reflect unusual circumstances such as a large project in the tract being represented by an outside broker.